Davidson Investment Advisors’ fourth-quarter commentary provides insights into the U.S. equity, taxable fixed income, municipal fixed income, and international equities markets.
U.S. Municipal Fixed Income Market
Let’s Do the Twist
Ringing in a new year for the municipal bond market has our ears perked. Despite a weaker spring and summer season, with yields rising after Liberation Day, the second half of 2025 saw yields decline as higher absolute yields led to robust investor demand. October was the strongest month of the fourth quarter, as continued investor buying and a seasonal end-of-year lull of supply created a more favorable market backdrop.
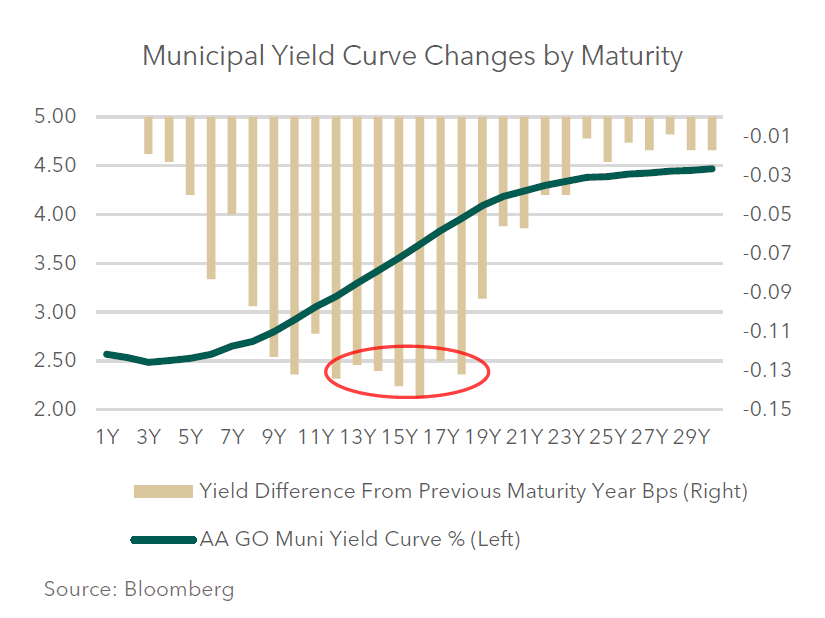
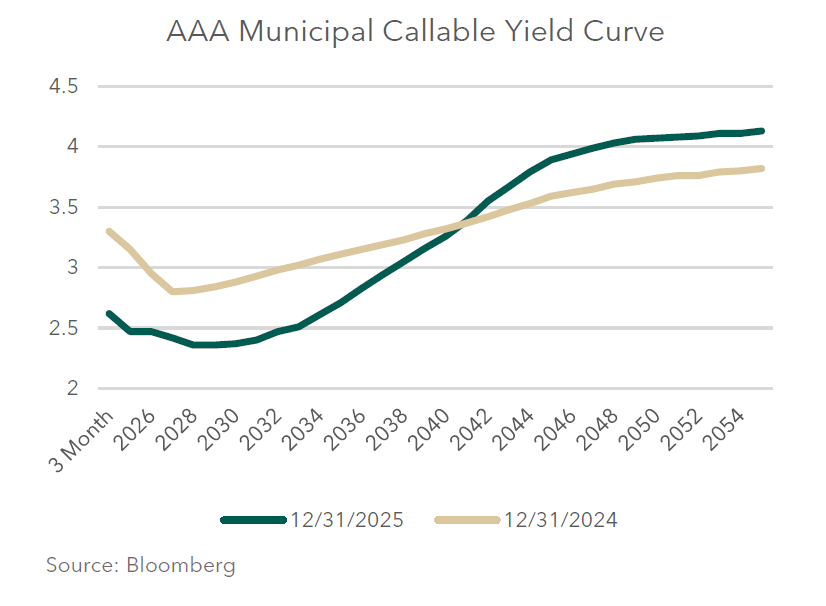
One of the keys to 2025 was a re-normalization of the yield curve, shifting its shape from a hockey stick (held below the crossbars) to a taller, sleeker S. Except for very short maturities being a bit elevated, this is an ideal shape of the curve. Investors receive compensation for buying longer maturities, more yield for more time to maturity. There are still many investors who focus on 5-year maturities and shorter, to match their current needs and outlook. Long maturities tend to be purchased by insurance companies and banks, which try to match the long-dated liabilities they own like life insurance and mortgage assets. These two factors caused the flatness on the short and long end of the curve while the rest of the curve twisted into “positive” shape. Maturities from 2040 and shorter declined in yield, point to point in 2025. Longer maturities rose in yield to offset both existing and expected inflation, as well as heavier new issuance.
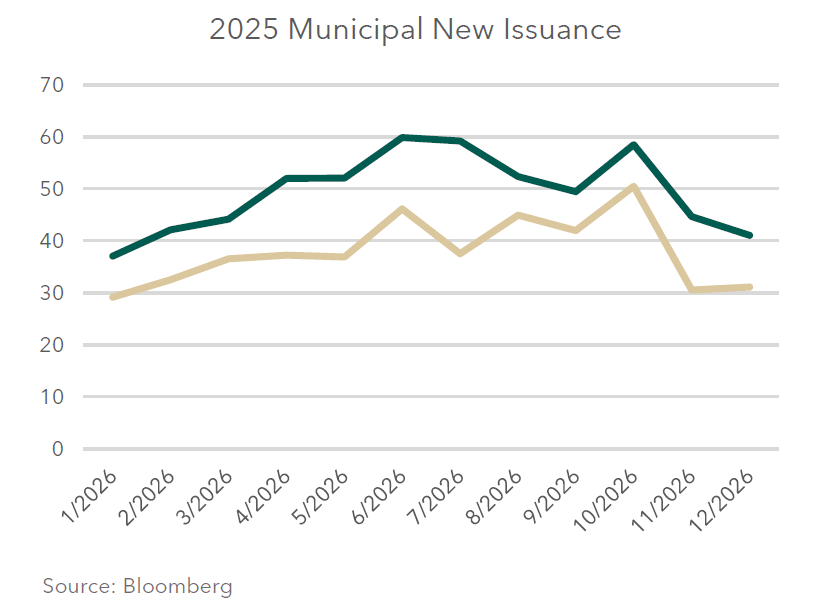
Growing municipal new issuance has been a primary focus throughout the year. We’ve seen a second year of record new issuance with over $567 billion in municipal bonds come to market in 2025, surpassing 2024’s $494 billion. Higher construction costs drove state and local governments to continue borrowing, and the need for additional infrastructure and energy is expected to continue growth into 2026. This will likely add to trading opportunities as reasonable growth of the market is beneficial.
Opportunities for investors are available as tax-equivalent yields for high quality municipals in the 15- to 20-year portion of the curve remain well above 6%, greatly surpassing that of even lower rated corporate alternatives. Our strategy has been lengthening portfolios and buying those longer maturities. We feel these tax-equivalent yields are relatively high and that even if these longer rates stay about where they are today (with offsetting risks of higher inflation or for Fed rate cuts in 2026), the “roll-down” will be complementary to the yield for enhanced total return.
Regardless of the Fed’s control of short-term interest rates and their dual mandate of stable pricing and full employment, the majority of changes in the municipal interest rate curve will mimic what happens in the taxable bond market. Swift changes will impart volatility.
Download the PDF to continue reading this quarter's commentary.
CLICK HERE
Davidson Investment Advisors, Inc. is a SEC registered investment advisor. The opinions expressed herein are those of Davidson Investment Advisors and are subject to change.
The information contained in this presentation has been taken from trade and statistical services and other sources, which we believe to be reliable. We do not guarantee that this information is accurate or complete and it should not be relied upon as such.
This presentation is for informational and illustrative purposes only, and is not intended to meet the objectives or requirements of any specific individual or account. Past performance is not an indicator of future results. Indices provide a general source of information on how various market segments and types of investments have performed in the past. An investor should assess his/her own investment needs based on his/her own financial circumstances and investment objectives.
The information on indices is presented for illustrative purposes only and is not intended to imply the potential performance of any fund or investment. Index performance assumes the reinvestment of all distributions, but does not assume any transaction costs, taxes, management fees, or other expenses. Indices are not available for direct investment.
The S&P 500® Index is a gauge of large-cap U.S. equities and serves as the foundation for a wide range of investment products. The index includes 500 leading companies and captures approximately 80% coverage of available market capitalization.
The Bloomberg Intermediate U.S. Government/Credit Bond Index is a broad-based flagship benchmark that measures the non-securitized component of the U.S. Aggregate Index with less than 10 years to maturity. The index includes investment grade, U.S. dollar-denominated, fixed-rate treasuries, government-related and corporate securities.
The MSCI EAFE® Index is broadly recognized as the pre-eminent benchmark for U.S. investors to measure international equity performance. It comprises the MSCI country indexes capturing large and mid-cap equities across developed markets in Europe, Australasia and the Far East, excluding the U.S. and Canada. Numerous exchange-traded funds are based on the MSCI EAFE® Index, and the Chicago Mercantile Exchange, NYSE Liffe U.S. and the Bclear platform of Liffe are licensed to list futures contracts on this index as well.
The MSCI Emerging Markets® Index is a free-float weighted equity index that captures large and mid-cap representation across Emerging Market countries. The index covers approximately 85% of the free float-adjusted market capitalization in each country.
The Bloomberg Dollar Spot Index tracks the performance of a basket of 10 leading global currencies versus the U.S. Dollar. It has a dynamically updated composition and represents a diverse set of currencies that are important from trade and liquidity perspectives.