U.S. equities have surged in the second quarter (2Q26) to-date (through 6/25/26), leading to solid year-to-date gains following a weak first quarter. We see a positive environment for additional equity gains in 2026, boosted by economic growth, solid earnings, and positive sentiment from rapidly falling oil prices that should support lower prices for gasoline, jet fuel, and diesel. An increase in 2026 and 2027 S&P 500 earnings estimates since the beginning of the year supports index gains, and we have increased our S&P 500 fair value estimate to 7,700 (from 7,100 previously) with a potential range of 6,700 to 8,100. Our fair value estimate of 7,700 is +4.7% from the 6/25/26 closing index price of 7,357 and is up +12.5% from the end of 2025.
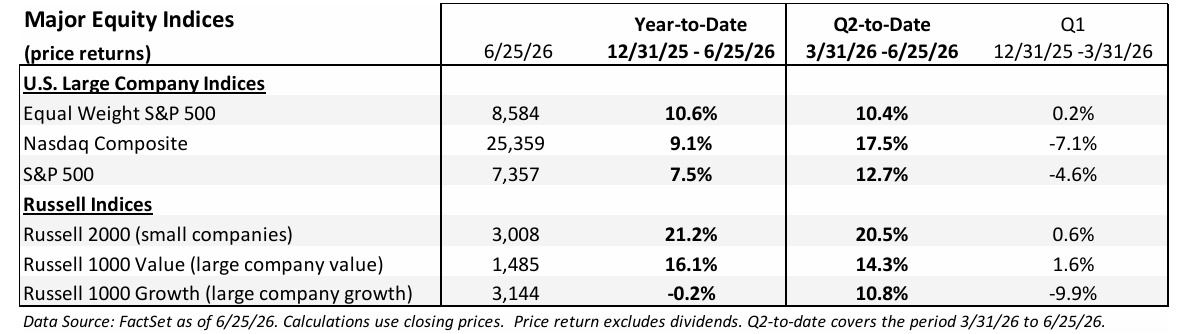
The second quarter equity rally began early in the quarter when investor sentiment surged on hopes for peace with Iran, as a ceasefire began on 4/8/26. A potential end to the war was a clear market driver, in our opinion, but we also credit two other material factors driving gains in equities. The first was impressive 1Q26 corporate financial results (mostly reported in April and May) that reflected S&P 500 year-over-year (Y/Y) revenue and earnings per share (EPS) growth of +12% and +28%, respectively. The second factor was strong business investment (non-residential fixed investment reported by the Bureau of Economic Analysis, BEA) that includes much of the artificial intelligence (AI) technology spending. In 1Q26, non-residential fixed investment increased +10.6% annualized from the previous quarter, the strongest quarter in three years and on top of relatively strong +4.1% business investment growth for all of 2025. We expect both trends to reflect ongoing strength in the second quarter as data is reported, creating a constructive second-half environment for equity investors. Equity market upside is not without risks, however, and we see potential headwinds from higher interest rates, stubborn inflation even as gasoline prices fall, hiccups in data center and technology spending, and U.S. mid-term elections this fall. This could lead to periods of volatility, even as the uptrend continues placing an emphasis on sector and asset class diversification, and portfolio rebalancing as needed.
Continue reading our Market Strategy commentary.
CLICK HERE
Important Disclosure: Information contained herein has been obtained by sources we consider reliable but is not guaranteed and we are not soliciting any action based upon it. Any opinions expressed are based on our interpretation of the data available to us at the time of the original publication of the report. These opinions are subject to change at any time without notice. Investors must bear in mind that inherent in investments are the risks of fluctuating prices and the uncertainties of dividends, rates of return, and yield. Investors should also remember that past performance is not necessarily an indicator of future performance and D.A. Davidson & Co makes no guarantee, expressed or implied to future performance. Investors should consult their Financial and/or Tax Advisor before implementing any investment plan.
Market Indices: The information on indices is presented for illustrative purposes only and is not intended to imply the potential performance of any fund or investment. Indices provide a general source of information on how various market segments and types of investments have performed in the past. Index performance assumes the reinvestment of all distributions, but does not assume any transaction costs, taxes, management fees, or other expenses. You may not invest directly in an index. Past performance is not an indicator of future results. The S&P 500 Index is a market cap weighted index that is designed to measure the US large-cap equity performance. The index is composed of the 500 leading publicly traded US companies based on size, liquidity, industry, and profitability criteria. The Dow Jones Industrial Average is a price weighted index that tracks 30 large, publicly owned companies trading on the New York Stock Exchange (NYSE) and the NASDAQ. The Russell 2000® Index is a market cap weighted index that measures the performance of the 2,000 smallest companies in the Russell 3000® Index. The Russell 1000 Growth index includes the Russell 1000 companies that exhibit relatively higher price-to-book ratios, and higher expected earnings and sales growth. The Russell 1000 Value index includes the Russell 1000 companies that exhibit relatively lower price-to-book ratios and lower than average expected earnings and sales growth. The S&P 500 Equal Weight Index is the equal-weight version of the S&P 500, which is weighted by market capitalization. In the Equal Weight version, each company is assigned an equal weight, about 0.2%, and is rebalanced quarterly.